Live Shiba Inc Crypto Data
How to Analyze Shiba Inc Data: Understanding Bid and Ask
Analyzing Shiba Inc data, particularly bid and ask prices, is crucial for identifying market trends and trading opportunities. These metrics reveal the supply and demand dynamics of the market, helping traders make data-driven decisions.
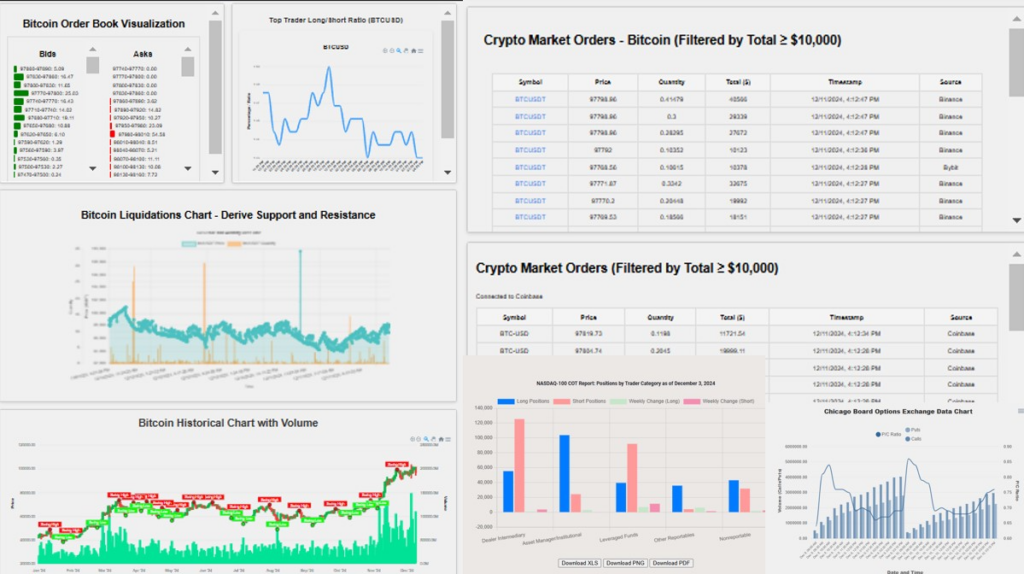
In trading, the bid price reflects the highest price buyers are willing to pay, while the ask price represents the lowest price sellers are willing to accept. When the bid volume (shown in green) of Shiba exceeds the ask volume, it indicates strong buying activity, suggesting upward pressure on prices. Conversely, if the ask volume of Shiba is higher than the bid volume, it points to selling pressure and potential downward price movement.
To analyze Shiba Inc data, start by observing the order book. Look at the quantities listed under bids and asks. If there are consistently higher volumes on the bid side, it signals that buyers are more active and aggressive, often leading to price increases. On the other hand, larger volumes on the ask side suggest sellers are dominant, which could drive prices down.
Monitoring real-time changes in bid and ask volumes of Shiba Inc is key. A sudden spike in bid volumes relative to asks often precedes a market rally, as it shows heightened buying interest. Similarly, an increase in ask volumes may signal a sell-off.
By understanding and analyzing the interplay between bid and ask volumes, traders can better predict market movements and make timely decisions to maximize their returns on Shiba Inc assets.

